Results
First Place Award
“First Place Award” goes to Tim McGraw and Michael Eddy from Purdue University, for best identification of flow features, excellent comprehensive visualization and new ways to study convective flow.
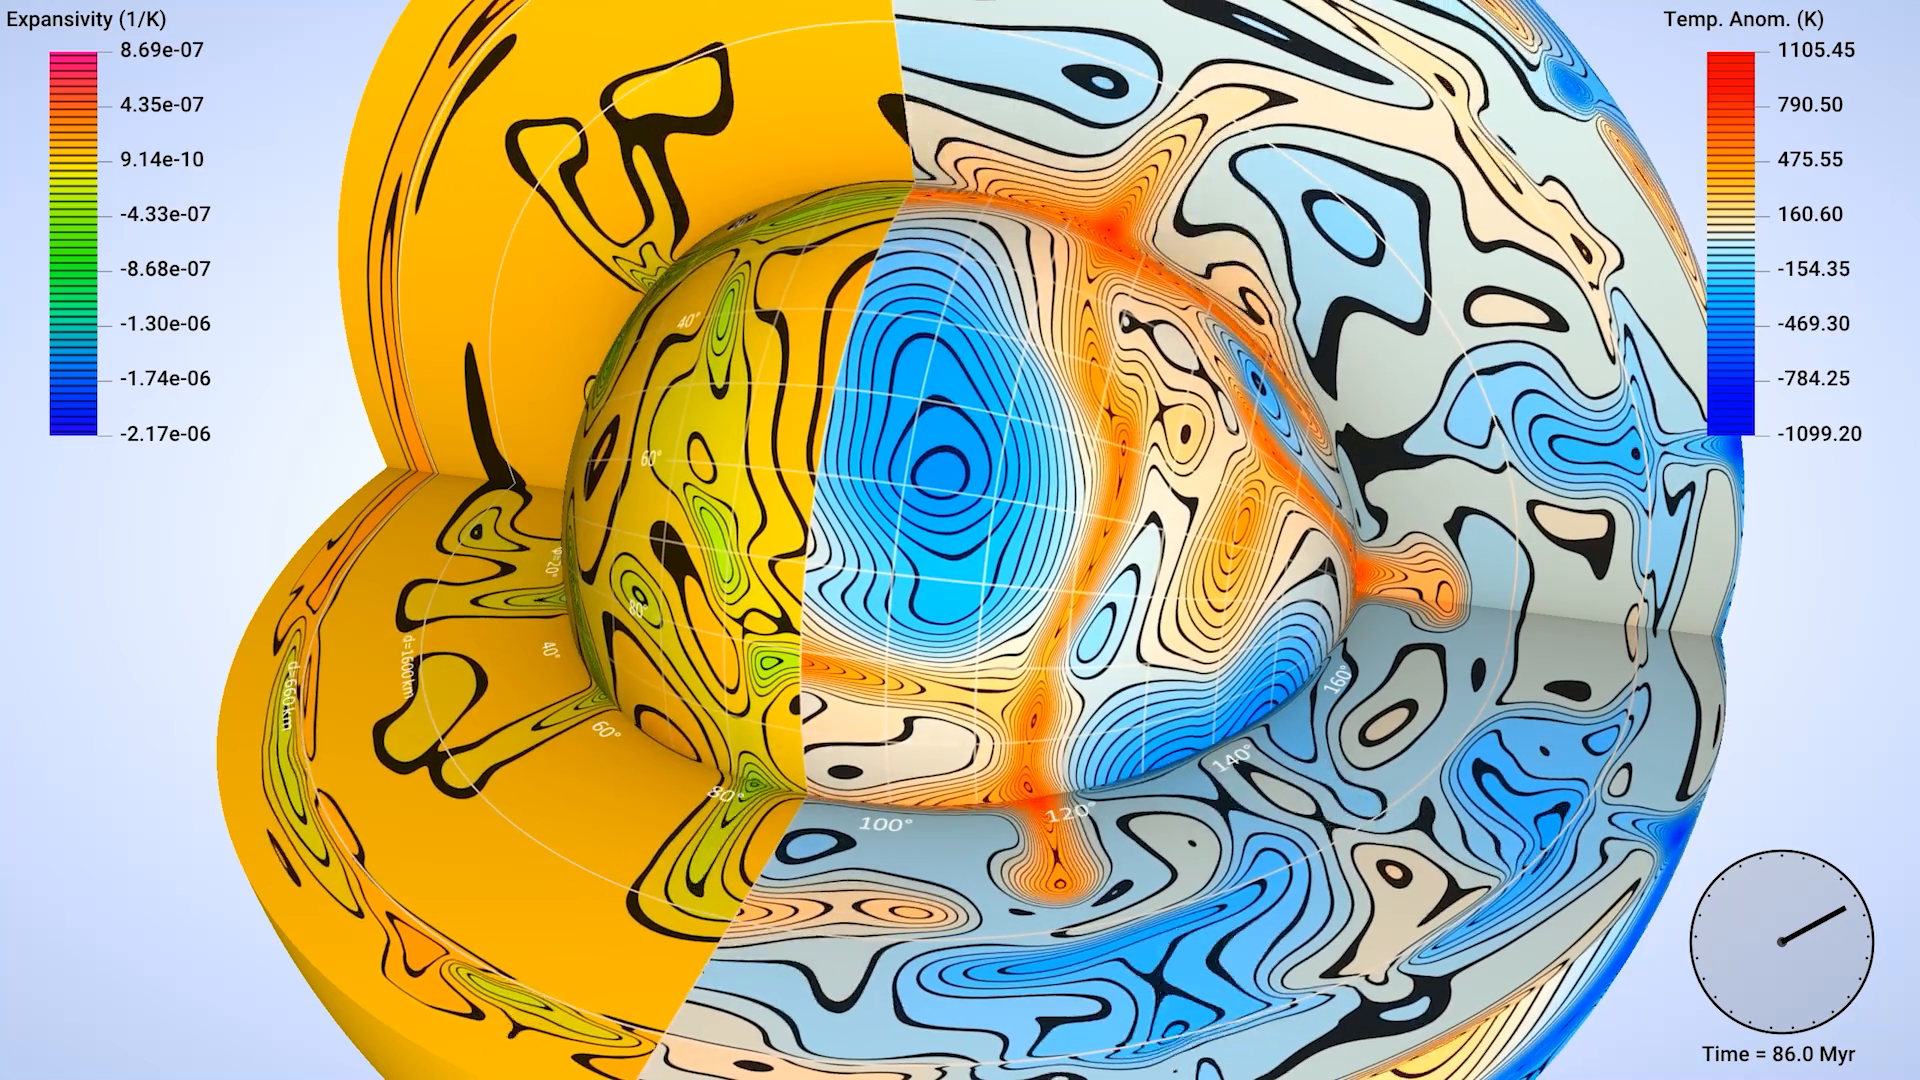
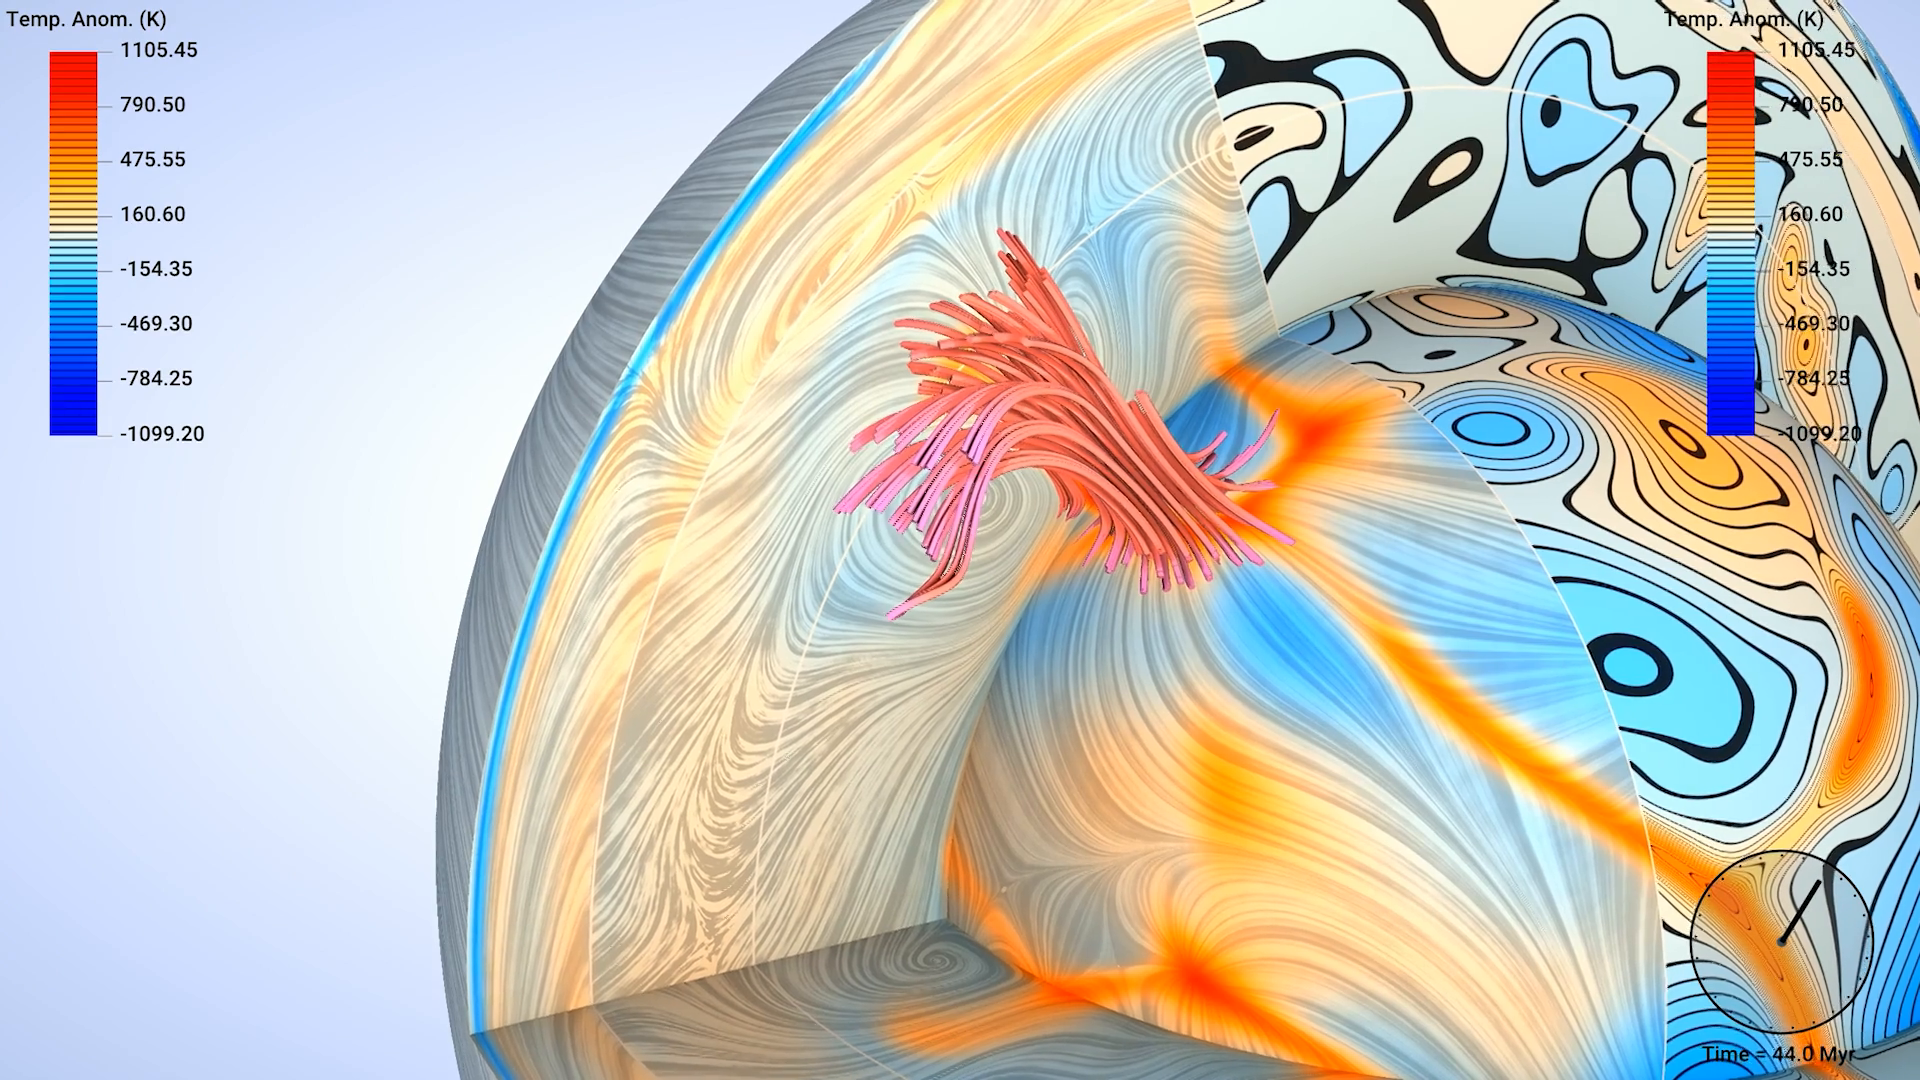
The team will be invited to submit a full journal article to IEEE Computer Graphics and Applications (CG&A) Journal.
The full presentation is available here.
Best Cover Visualization
“Best Cover Visualization” award goes to Lucas Temor (Univ. of Toronto), Peter Coppin (OCAD University), and David Steinman (Univ. of Toronto), for using the 3D cartographic projection to provide a full and immersive view of the mantle processes that is not possible in the conventional 3D spherical geometry, and for using warped planes in the same projection to show several variables side-by-side.
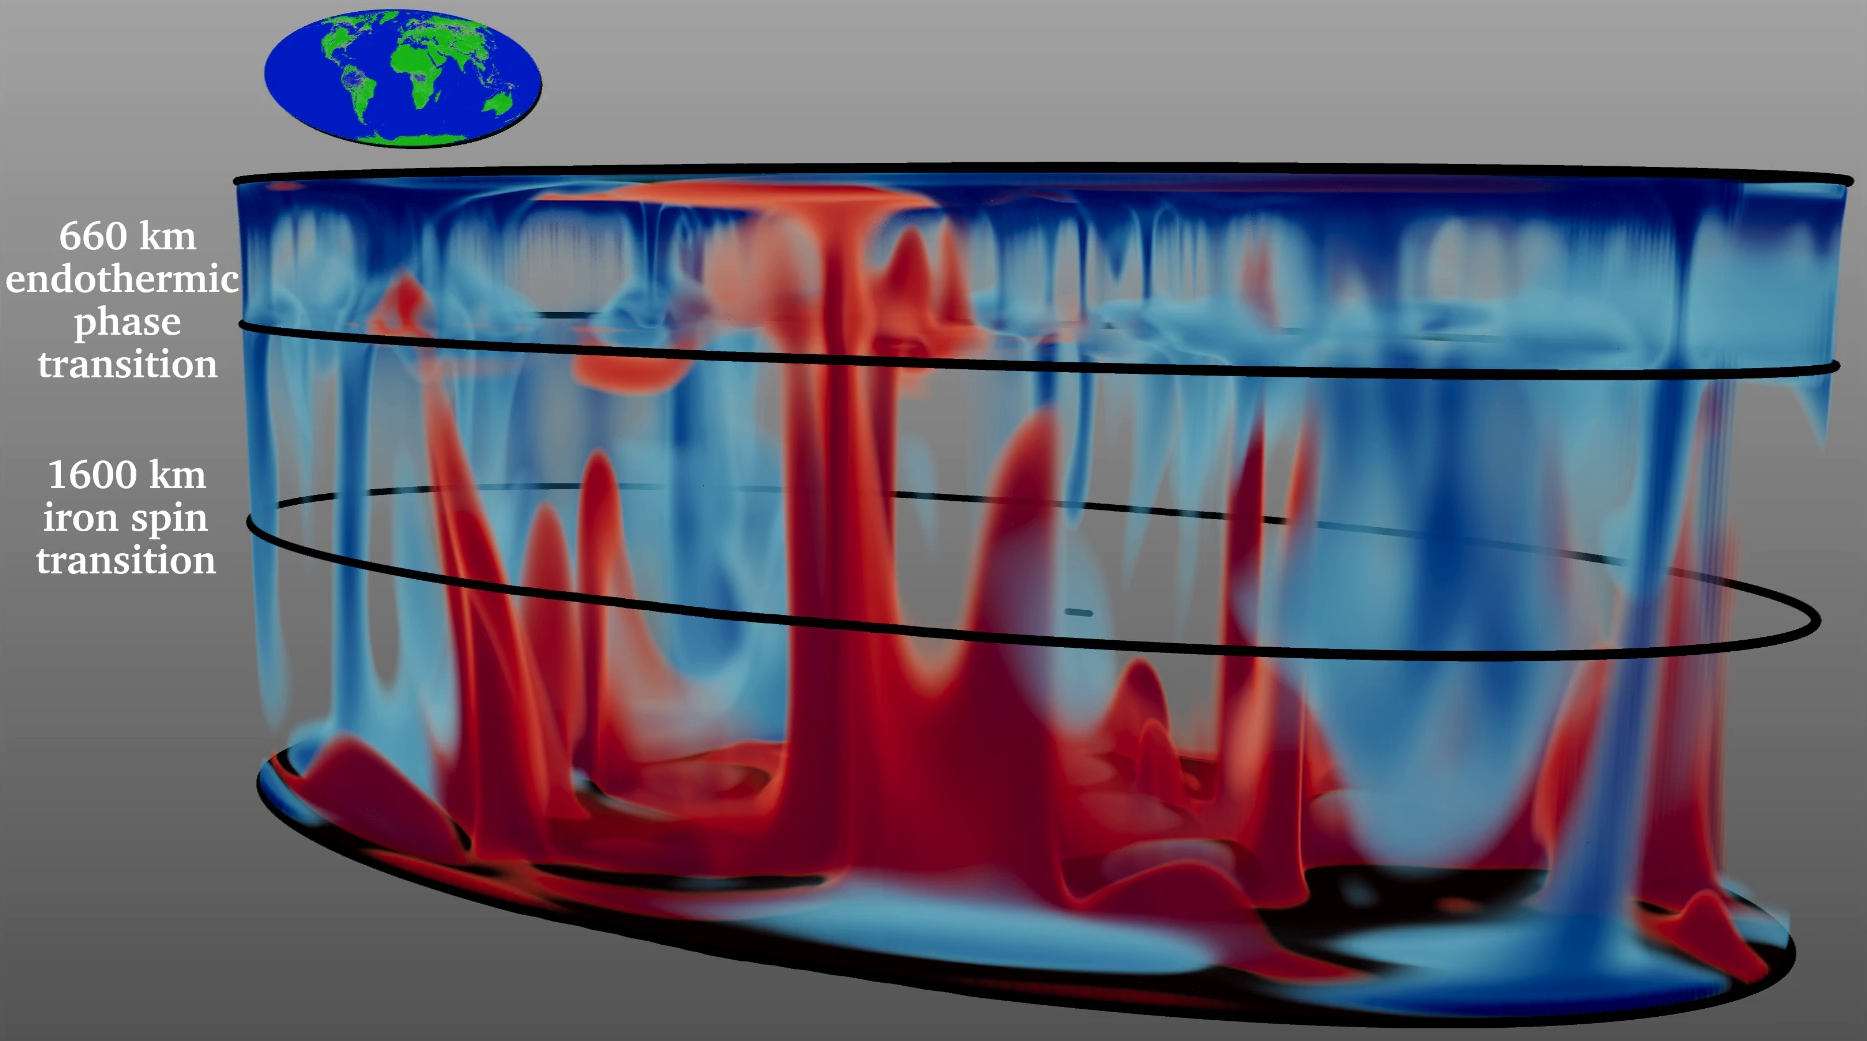
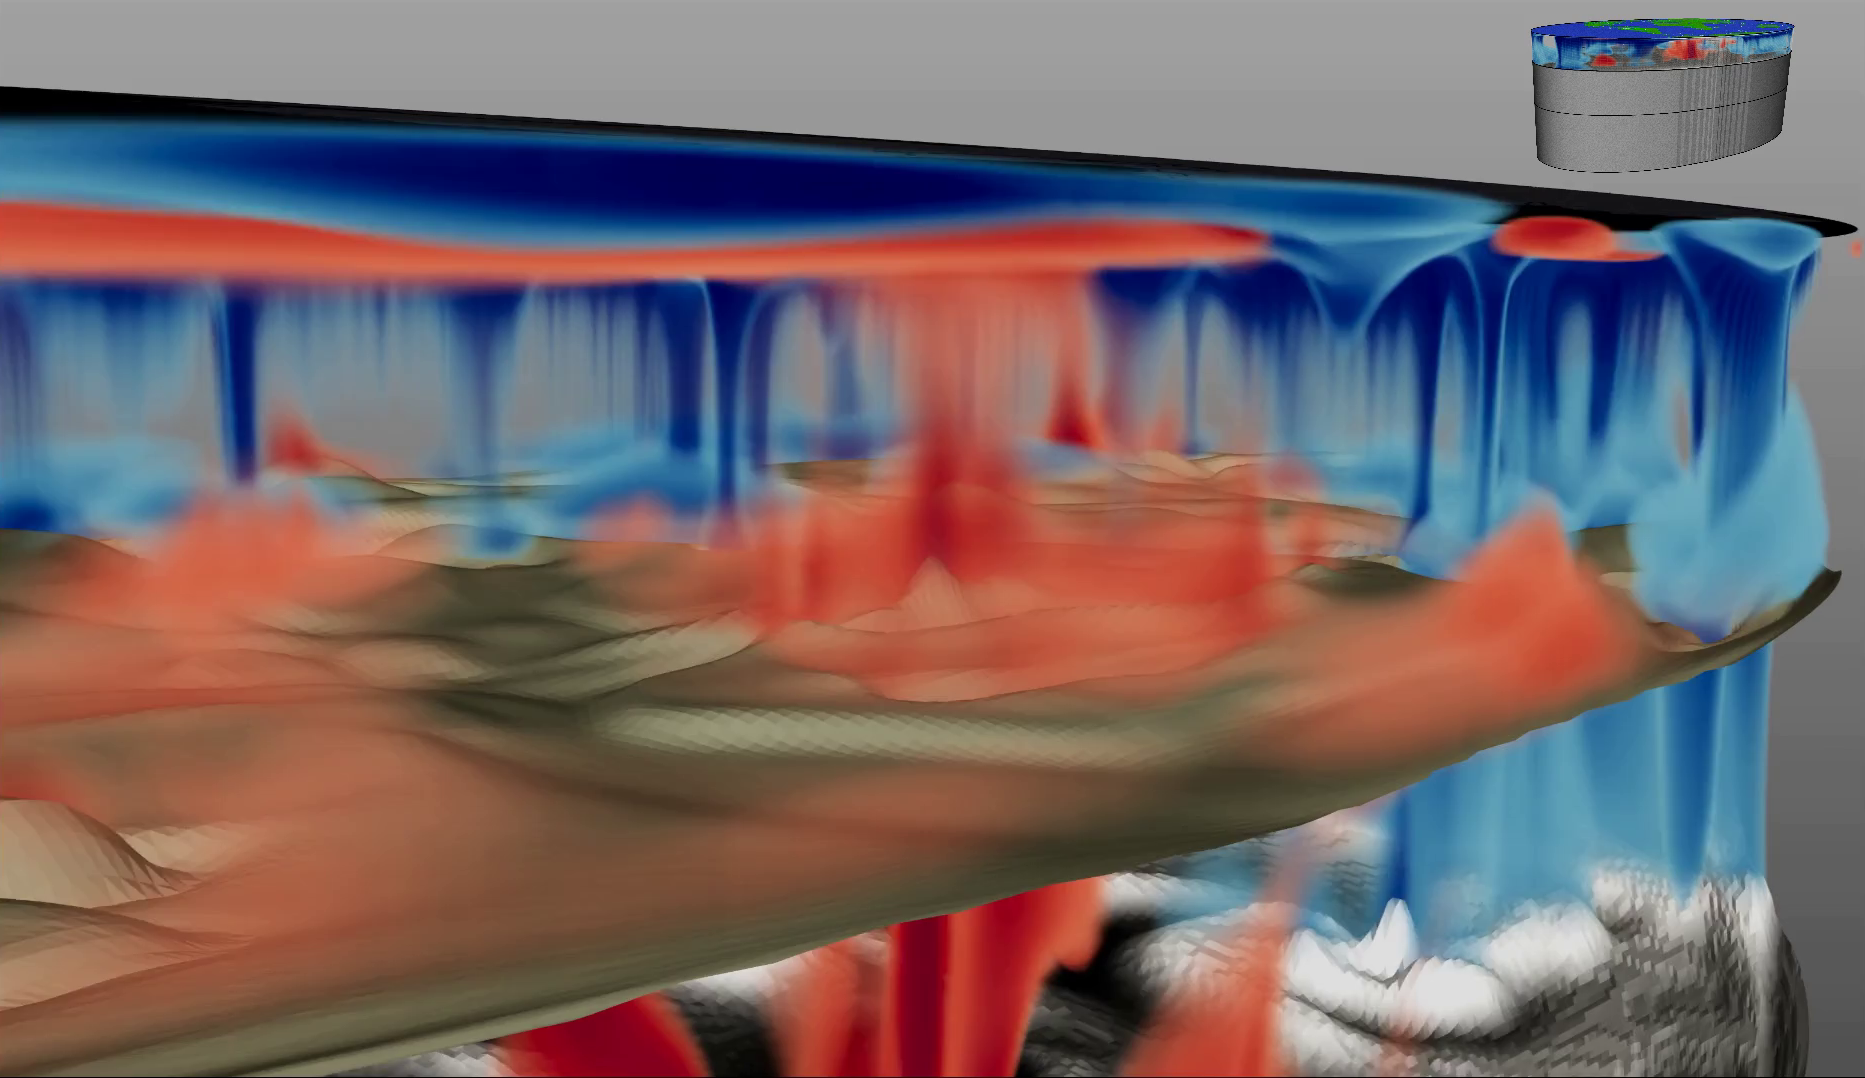
The full presentation is available here.
Best Interactive Visualization System
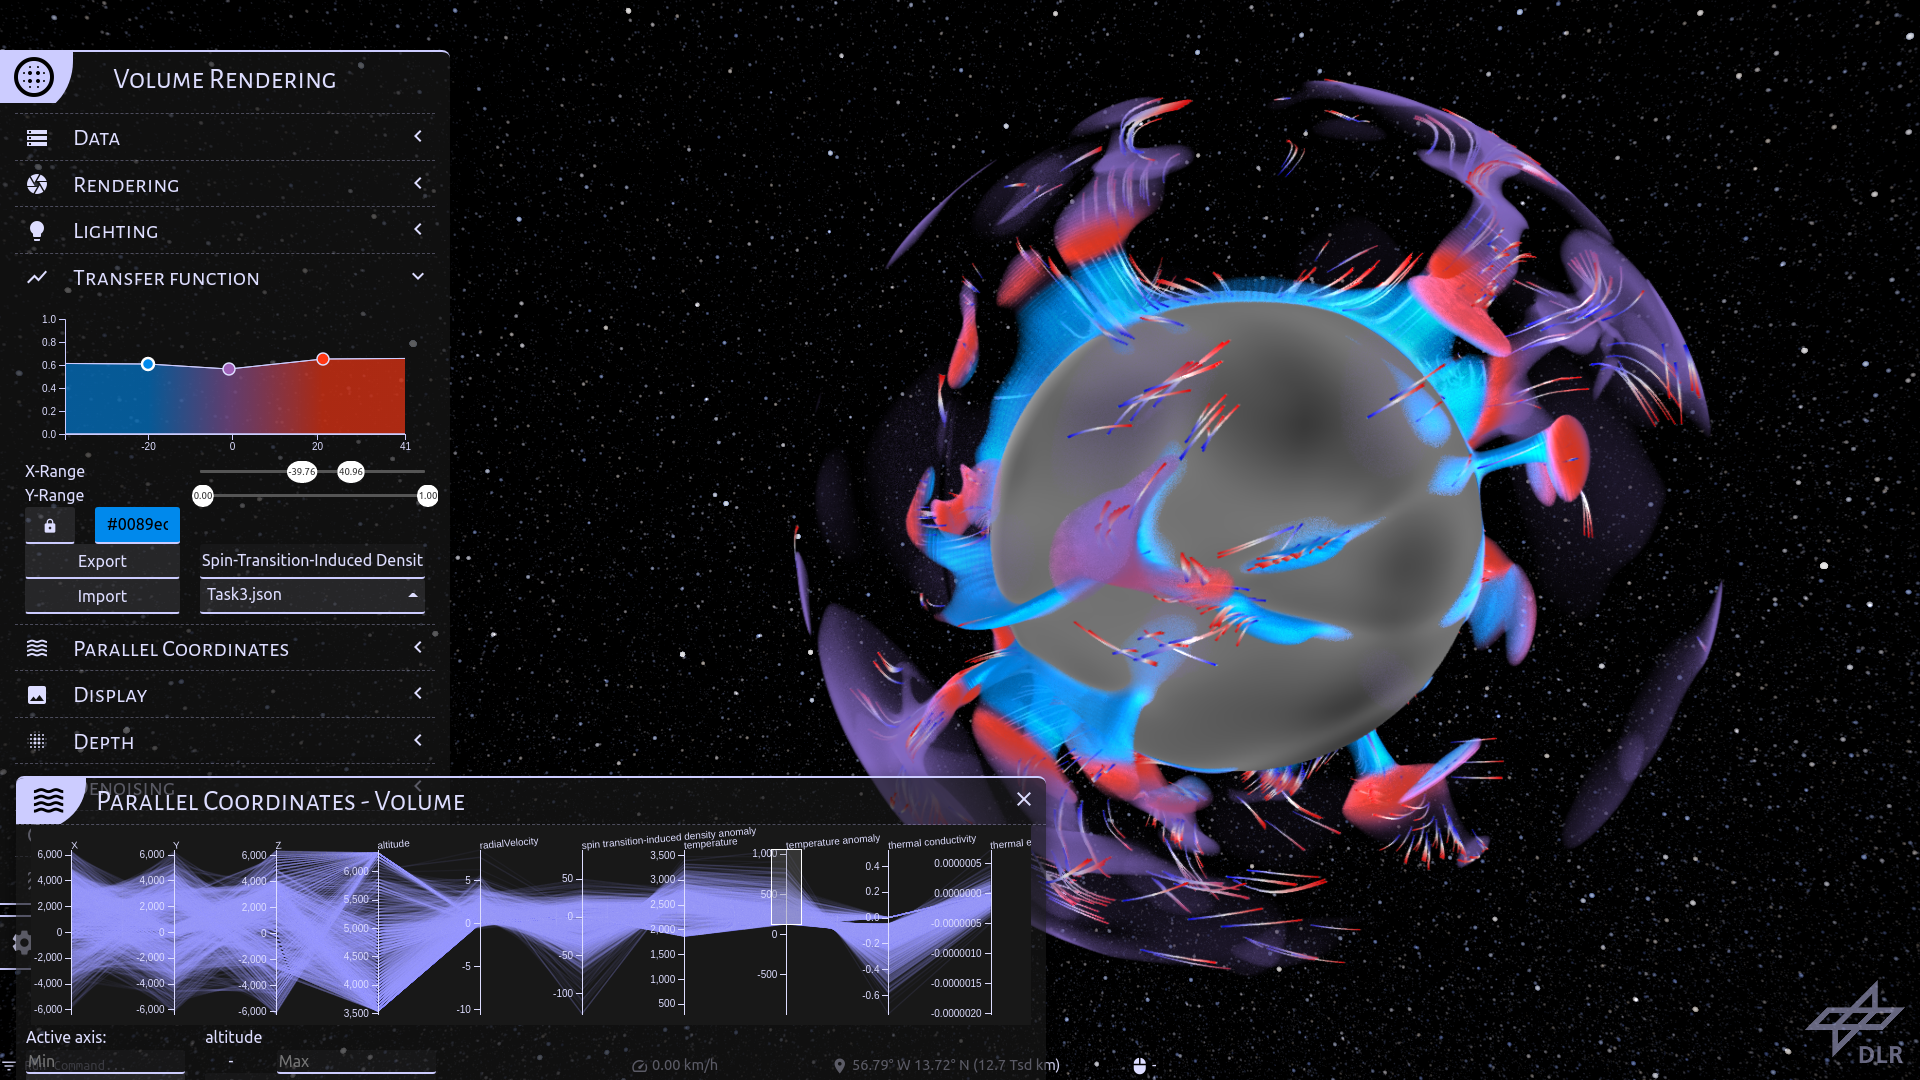
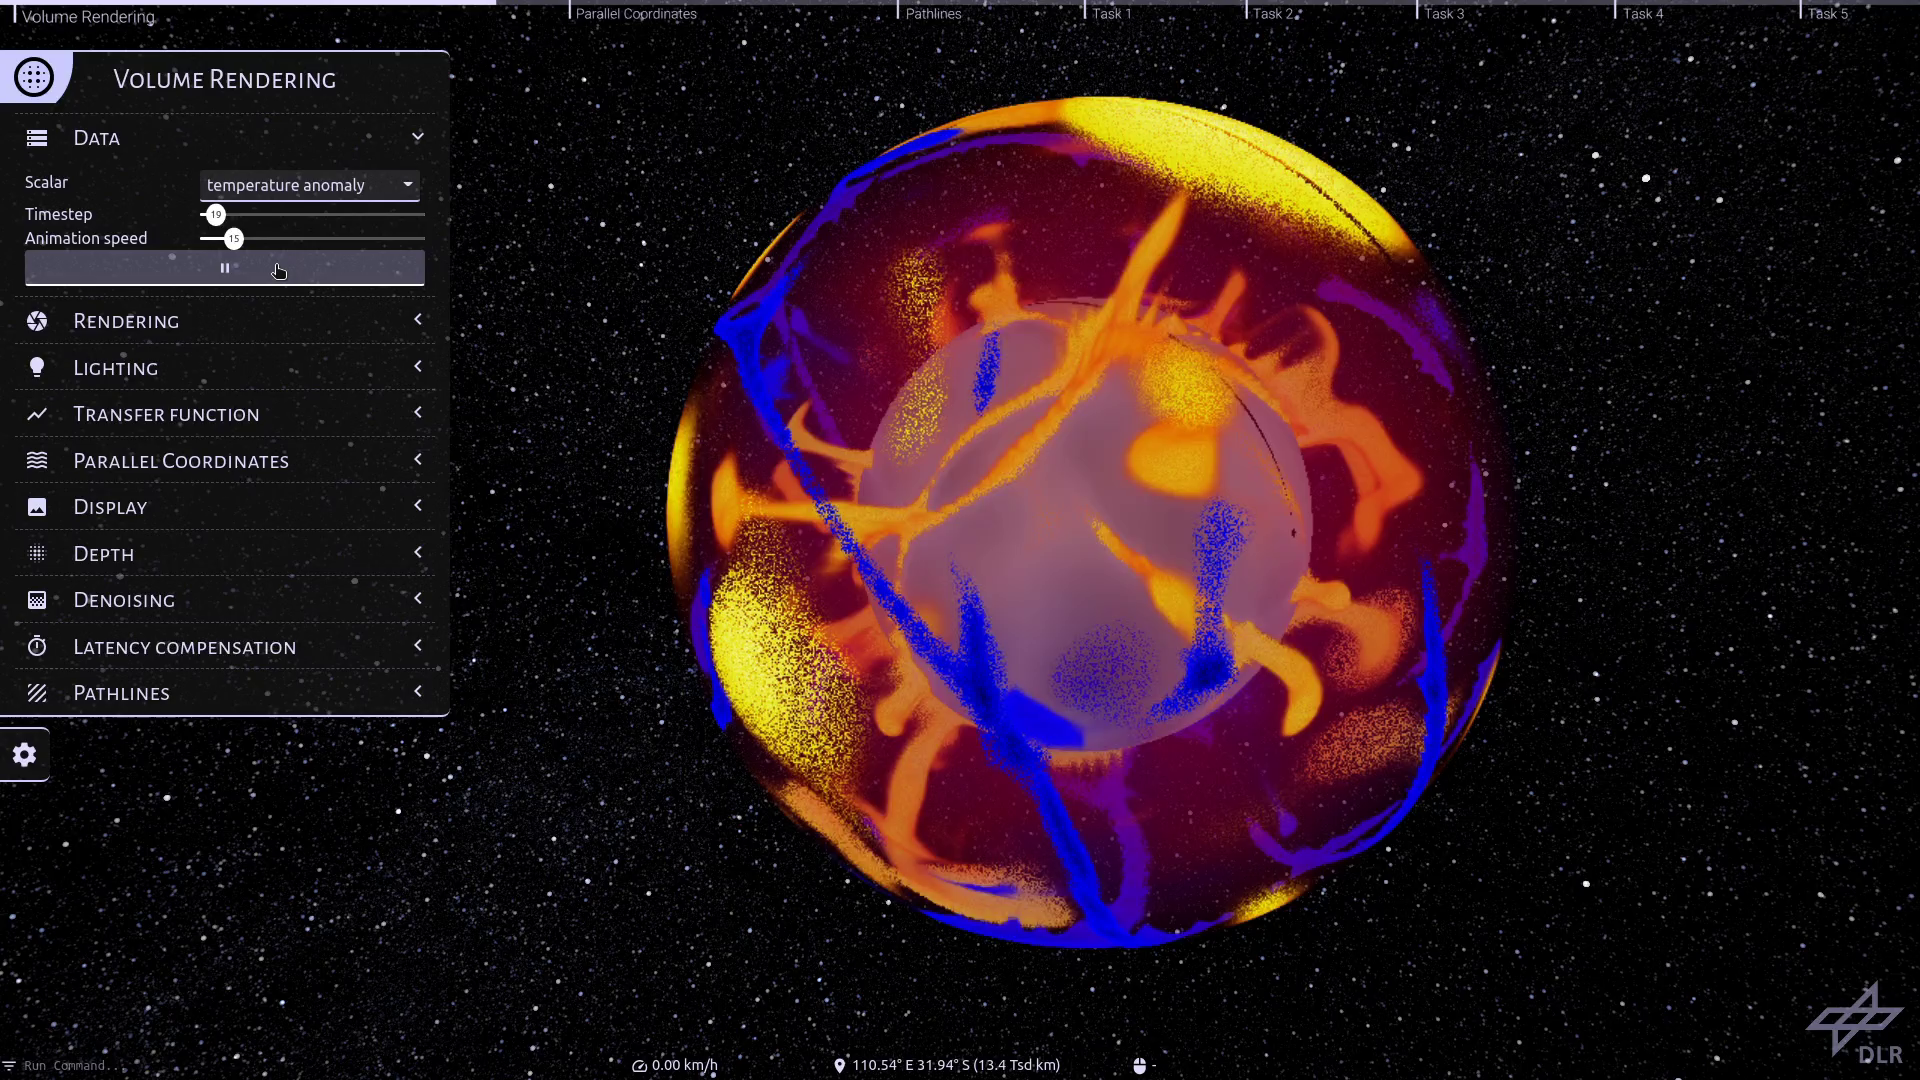
“Best Interactive Visualization System” award goes to Jonathan Fritsch, Simon Schneegans, Markus Flatken, Prof. Dr. Andreas Gerndt, Dr. Ana-Catalina Plesa, and Dr. Christian Hüttig from the German Aerospace Center, for the ray tracer that emphasizes interactivity, with progressive volume rendering and image warping.
The full presentation is available here.
The Innovation Award
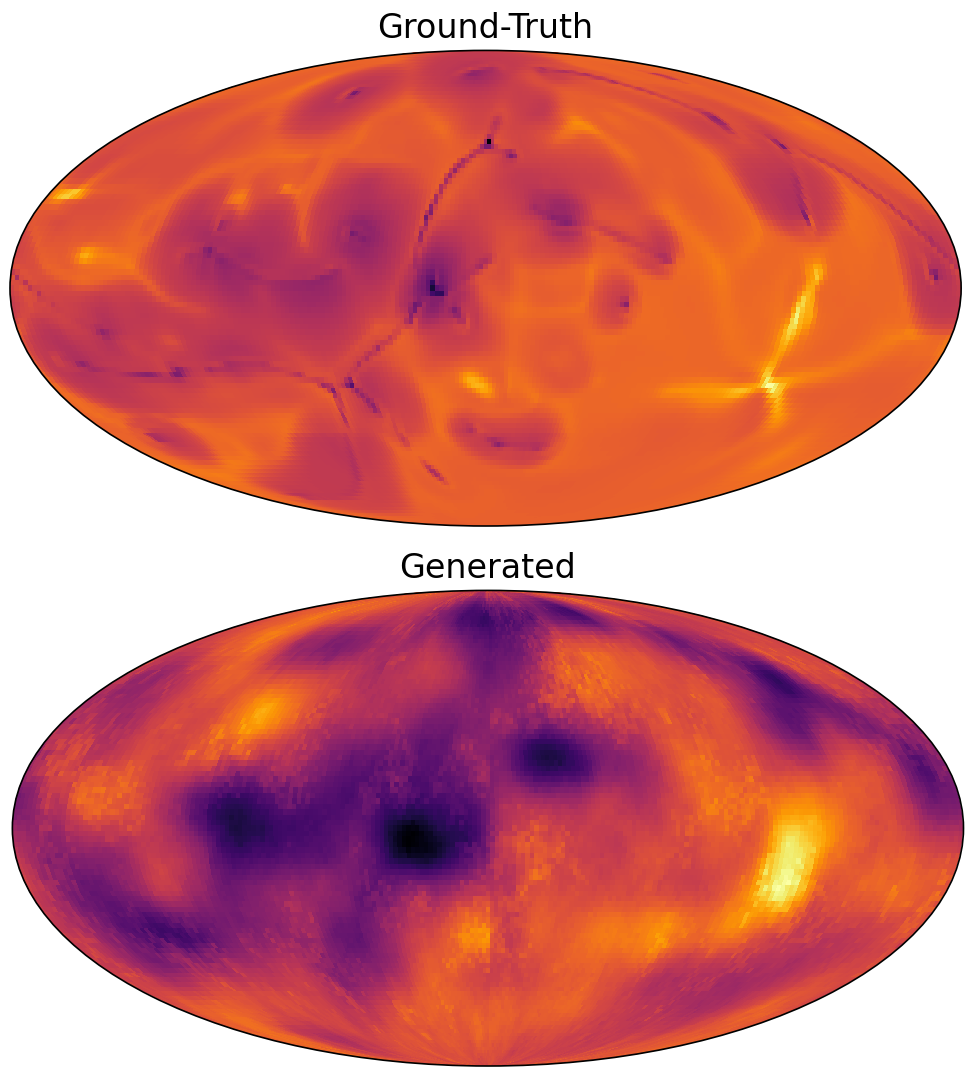
“The Innovation Award” goes to Tim von Hahn and Chris K. Mechefske from Queen’s University, for using a generative adversarial network (GAN) to create a surrogate model of the Contest dataset that captures most of the features of the original data. This approach does not compete directly in regular visualization categories, but it is so unique that we decided to give it a special award.
The full presentation is available here.